Net Worth
Tracks your total assets minus total liabilities over time.
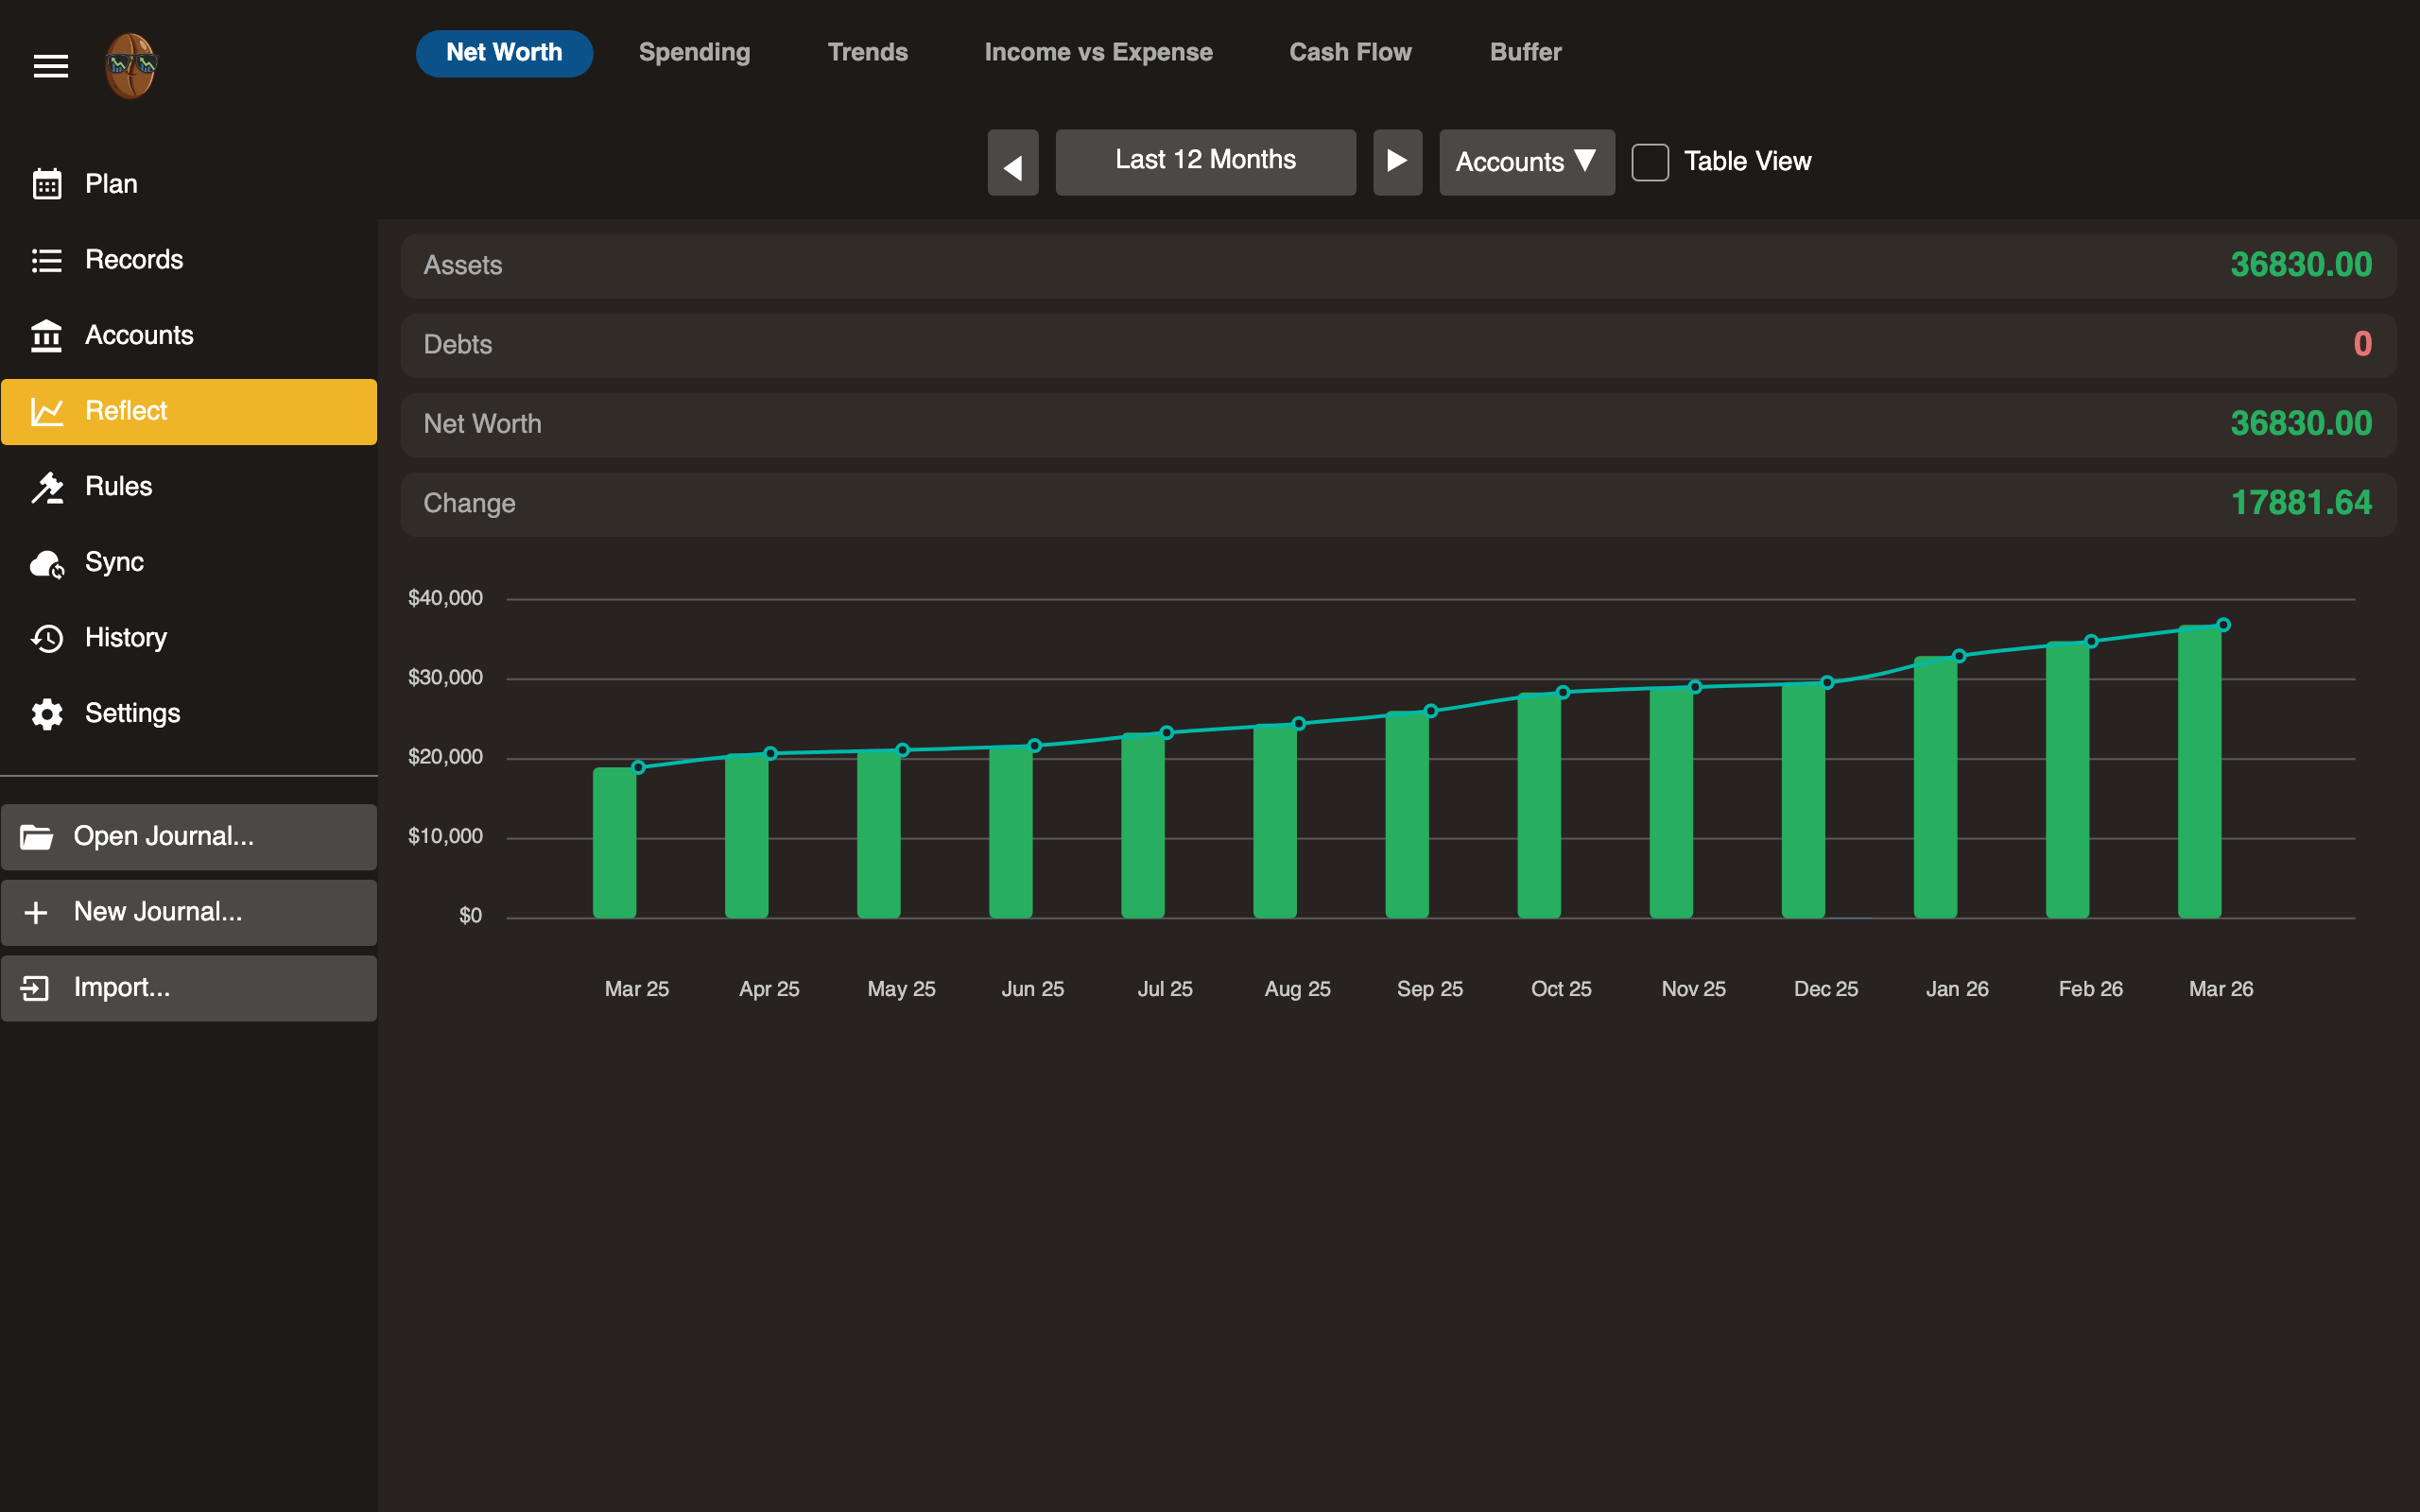
Reading the chart
- Assets, the top line: sum of all asset accounts such as checking, savings, and investments.
- Liabilities, the bottom line: sum of all liability accounts such as credit cards and loans.
- Net Worth, the middle area: assets minus liabilities.
The chart shows monthly data points. Hover over a point to see exact values.
Date range
Adjust the date range to zoom in on a specific period or view the full history.
Multiple currencies and securities
When your journal holds more than one commodity, net worth is converted into your reporting currency using market prices, so the chart stays one number. Each historical point is valued at the prices as of its own date, so past months do not shift when new prices arrive.
A By currency breakdown lists each commodity you hold, its native amount, and its converted value, so you can see what makes up the total.
Fetch prices pulls current rates and security prices and appends them to your journal. If a commodity has no price, net worth flags it as unpriced rather than guessing; fetch prices or add one to include it. See Multi-Currency for how prices work.
Currency change
Net worth uses current market prices, so it moves as exchange rates and security prices move, even when you make no transactions. Holding euros while the euro strengthens raises your net worth on its own. This is unrealized currency gain.
The currency change line isolates how much of a period’s change came from rate and price movement rather than real activity, so a market swing never looks like income or spending. Your Spending and budget reports are unaffected: a foreign purchase is valued at the rate on its date and never re-valued.